How to use Neptune with Plotly#
![]()
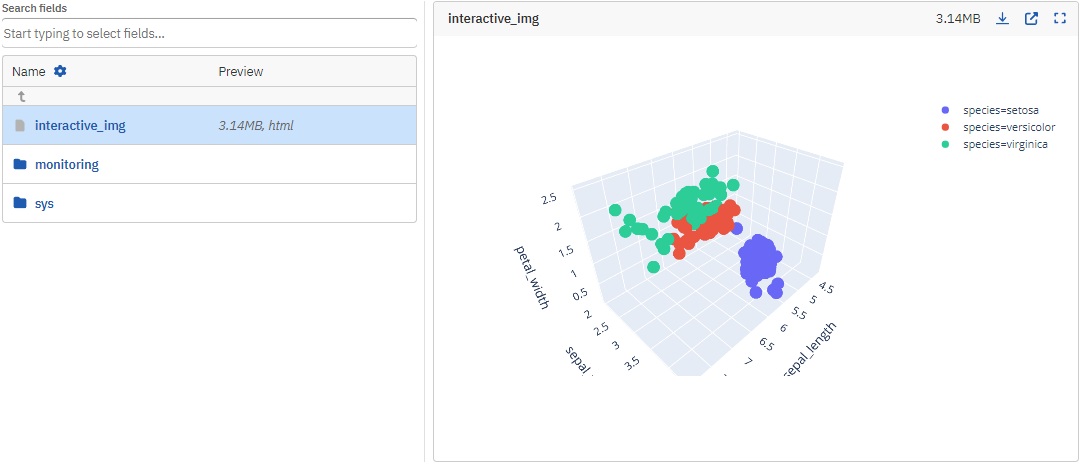
Plotly is one of the most common Python graphing libraries for interactive graphs. With Neptune, you can log interactive 2D and 3D charts as well as point clouds.
Before you start#
- Sign up at neptune.ai/register.
- Create a project for storing your metadata.
-
Have Plotly and Neptune installed:
Tip
To follow the guide without any setup, run the example notebook in Colab
Plotly logging example#
-
Import Neptune and start a run:
-
If you haven't set up your credentials, you can log anonymously:
-
-
Create a sample figure:
-
Upload the interactive figure:
-
To stop the connection to Neptune and sync all data, call the
stop()method:
To open the run, click the Neptune link that appears in the console output.
[neptune] [info ] Neptune initialized. Open in the app: https://app.neptune.ai/workspace/project/e/RUN-1
Result
The resulting figure is logged as an HTML object.
You can view it in the All metadata section.